NetCapper
Thoroughbred Handicapping:
Learning, earning and loving the track.

|
NetCapper |
|
|
The Capper's New Features For more information on The Capper, click here. Note: The features are displayed in reverse chronological order, with the newest additions on the top of this page. �Due to a user's request, I've added an option to display HDW pace figures instead of the fractional times in The Capper's printed pps. Here's how the printed pps normally look with the race fractional times for each past performance displayed:
Here's how the same pps look with the HDW pace figures for this horse displayed instead:
It's traditional to show the fractional race times in the pps, but it really is more useful to display each horse's adjusted pace figures instead. For one thing, the unadjusted fractional times are fairly meaningless unless you have encyclopedic knowledge of all the relevant track speeds and daily variants. It's a lot easier to see each horse's relative ability, condition over time and pace situations using adjusted pace figures instead. �There's a new tab in the General Reports dialog called Betting Line Charts. Its purpose is to let you choose which tracks to play, and whether to play overlays or tote action horses, at any given time. My general method of using charts is discussed in the Spot Play Demo. It's a little more complicated than this, but basically I want to make a play when the Profit/Loss Line is above the 2 Week Moving Average line. In the example below, the time to be playing overlays at Churchill Downs using my betting line was in a period between mid-2005 to early summer 2006. The reality of computer handicapping is that the program will latch on to certain factors and be able to take advantage of them for a period of time, but that edge will almost always be intermittent. The betting line charts let you see if the betting line is profitable or not right now.
�Included a Bets dialog. The new Bets dialog can report on all bets that you've made. Entry of bets is very simplified. No longer do you need to enter the track, surface, distance, class, program numbers, etc. for every bet you make. Instead you choose from a list of races and make a few clicks to inform The Capper of your bets. The results of your bets are automatically updated when you download the binary results and recalculate your models. You can then get four different types of reports, filtered by the start date, end date, betting account and bet type of your choice. Here's what the initial Bets dialog looks like:
To enter a bet, you click on the Enter Bets button to bring up the Enter Bets dialog. You then click the race in which you made a bet (the race that comprises the first leg if it's a serial bet) from the list on the left. You also click the bet amount, bet type, and optionally, the Reason Bet and Account.
You then click the Enter Horses Bet button to bring up the Enter Horses Bet dialog. If you're entering a win bet, you simply check the horse(s) you're betting and click the Save button:
If you're entering an exotic bet, say a Pick-3, the dialog would look something like this. Again, you'd simply check the horses in each leg of the ticket you're entering.
Bets are entered before the binary results charts for that day are downloaded and the models are recalculated. (This is an automatic part of the Download, Import, Recalculate, Print process.) Once the results are in, you can look at your bet reports. Here's an example of the Bets Summary (these are all imaginary bets):
Here's an example of the Bets Breakdown:
Here's an example of the Bets List:
And finally, here's an example of the Bets Chart. This report, like the spot play charts, displays the profit/loss for a given type of bet over a period of time:
The pick lists at the top of the Bets dialog allow you to filter the bets for your reports. You can filter your reports by the start date, end date, betting account and bet type of your choice. 4/16/07:
�Added a new icon to the icon bar and a new menu choice to the View menu: DIRP. This stands for Download, Import, Recalculate and Print new races. In my ongoing effort to reduce all human endeavor to one click of the mouse, the DIRP icon is a milestone. I now sometimes say I'm going to "DIRP" the races rather than handicap them -- it's becoming part of my personal lexicon.
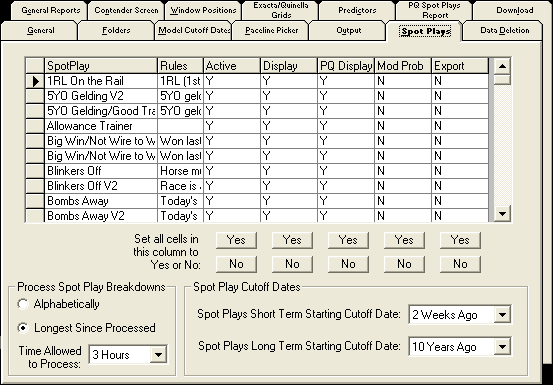
When you click the DIRP icon, the Download form will appear, with a slight difference. (Although first you may get prompted as to whether you want The Capper to process your Spot Play Breakdowns.) Instead of "Download Selected Files" and "Close", the buttons on the Download form say "DIRP" and "Cancel DIRP":
After you've selected your files for download (or accepted the pre-selected ones), you just click the DIRP button. That's it -- just walk away from it. It's still not really one-click handicapping -- there are actually still at least two clicks. (I'll work on that.) But it's a great process if you want The Capper to do everything overnight so you'll have your reports in the morning. �4/26/2004 �The Spot Plays tab of the Setup dialog has a few more settings in the bottom-left corner. These help with the processing and printing of your Spot Play Breakdowns. (This process happens, if you choose, while recalculating your models, or if you go to the Spot Play Breakdown tab of the General Reports dialog and click the button.) First, these new settings allow you to choose whether your Spot Play Breakdowns will be processed in alphabetical order or by starting with the one that's had the longest time since it was last processed. The latter choice is the default, and the one I suggest you stick with. Second, you can choose the amount of time you let The Capper take when it starts processing your breakdowns. It default to 4 Hours, which is probably about right for most users.:
This new feature is for the convenience of those of you who like to import, recalculate and print new races at night while you're sleeping. You can now answer Yes to the prompt that asks you if you want to process your breakdowns. The Capper will import your files, recalculate your models, process your breakdowns for 4 hours (or however long you set it), and then print out your new races. This way, all your races should be waiting for you in the morning and your most out-of-date spot plays will have been updated. If The Capper is still processing when you get up in the morning, that's a sign to set the "Time Allowed to Process" prompt to something shorter. Remember that this Process and Print Spot Play Breakdowns process doesn't just create the spot play breakdown reports that you look at. It also compiles the statistics that the PQ Spot Plays report uses. That's one of the reasons it's good to keep your breakdowns as up-to-date as possible. This new feature should help with that, even as the list of spot plays in The Capper grows ever larger. �4/26/2004 �There are a LOT more public spot plays in this version. You'll see that some old favorites have similar plays with a "V2" after their name, such as "Blinkers Off V2." In these situations, I've used the long-term breakdown to hopefully improve the spot play. The older versions have been kept for research purposes. Here is a list of all the public spot plays so far:
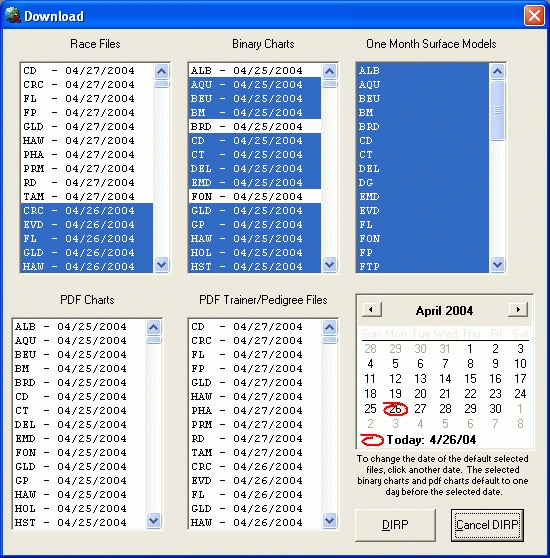
�This new version has a neat new capability. The Download form removes the need to go to the HDW website to select and download files. This form will automatically pre-select certain files based on your settings. You typically only need to click one button to have all your HDW files downloaded. Here's what the Download form looks like:
The highlighted files are pre-selected for download. Notice that there is a list for the five types of files that are available to Capper users: race files, binary charts, one month surface model files, PDF charts and PDF trainer/pedigree files. The calendar will default to today's date. If you want to select a different date, just click on that day on the calendar. The pre-selected race files and PDF trainer/pedigree files will default to the selected date. The pre-selected binary charts and PDF charts will default to the day before the selected date. All the one month surface model files are selected by default. Obviously, you can use your mouse to change the selected files. You can choose any combination of files in a particular list by clicking or dragging your mouse over the list while holding down the Ctrl key at the same time. My settings are to pre-select all of today's race files, all of yesterday's binary charts, none of the PDF Charts, and none of the PDF Trainer/Pedigree Files. All the One Month Surface Model files are pre-selected by default. So, once the form is displayed, all you have to do is click the "Download Selected Files" button, and all your files are downloaded. Then just click The "Close" button to close the dialog, and you're ready to go. The Download form is accessed by clicking the new Download option under the View menu, or by clicking the new Download icon, the second icon from the left in The Capper's icon bar:
Make sure that you have an open internet connection before you click the Download icon, because The Capper has to access the HDW site to find the list of available files and then to download the files you select. The new Download tab in the Setup dialog allows you to configure the Download form:
Enter your HDW user name and password (the name and password you use to log into the HDW website) into the appropriate boxes on this tab. This allows The Capper to access the HDW website. If you want to pre-select PDF Charts or PDF Trainer/Pedigree for downloading, check the corresponding boxes. Finally, if you want to configure The Capper to pre-select certain tracks, you can do that here by toggling the tracks you want to a Y or N in the track list. �2/16/2004 �Added a new option for sorting the PQ Spot Plays report: it can now be sorted by spot play + track + race +program number + subcategory. If your settings bring up multiple plays for each horse, this sorting option will group all the plays for each horse together, so you don't have to search through the report to make sure you're not duplicating bets. �2/16/2004 �Added a "Restore All Factory Settings" button to the Setup dialog. By clicking this button, you can restore (almost) all The Capper's settings back to the current factory defaults. I've also updated the factory settings so that they comply to the settings I'm currently using. (There are a couple of exceptions. The "Use Spot Plays to Estimate Probabilities When Available" option's factory setting is unchecked. I actually have that option checked. While I do think the option improves the betting line, it also doubles the time it takes to compute a betting line. So I set the factory setting as unchecked. If you don't mind the extra time it takes in computations, check this option. The second exception is the Print Option: I use "Export as PDF." This setting can confuse new users when they try to print something out and nothing shows up on their printer. So the factory default is set to "Print and Export as PDF.") �2/16/2004 �To update the stats that the PQ Report uses to find its plays, you have needed to click the "Process and Print All Spot Play Breakdown Reports" button on the Spot Play Breakdown tab of the General Reports dialog or tell The Capper to process all the spot play breakdowns while recalculating the models. The process of updating all the Breakdown reports also updates the stats used by the PQ Report. You probably only need to do this once a week or so if you're looking at long-term data in your PQ Report. But this process takes a long time -- it's usually something you want to do overnight. This version is changed in that if you go to the General Reports dialog and click on a single spot play to compute its Breakdown Report, the stats for that spot play will also be updated for use in the PQ Report. This is helpful if you're in a hurry or if you're only interested in one or two spot plays. �2/16/2004 Added these new spot plays: �DSP: Top
PC Horse. �This new version contains an option that allows you to use the win% of spot play subcategories to override the probabilities in the betting line. The PQ Settings tab in the Setup dialog is used to select the Spot Play/Subcategories which qualify. Any spot play/subcategories that qualify (for instance, Dam ROI/Statebred), if they show up in a race, override the previously computed probabilities for that horse. For instance, these are the settings I currently have in my PQ Settings tab: Minimum # Long-Term Bets: 50, Long-Term Profit: Best; Long-Term ROI: at least 1.10.
In this race you can see that Spirited had a spot play/subcategory (Fastest 1C/High Clmr > 25K) that qualified for under my PQ settings. This horse's probability was then determined by this spot play/subcategory rather than The Capper's normal process. In this case, it reduced Spirited's original probability, which worked out because Jovially moved up to the top spot and happened to be the winner:
It's a whole new paradigm for estimating probabilities and computing fair odds, which is one of the main functions of The Capper. For the first time, sporadic handicapping situations are used to estimate probabilities, rather than only measuring every horse for the same handicapping predictors. The effectiveness of this option will greatly depend on the settings you configure in the PQ tab of the Setup dialog because that determines which spot play/subcategories show up. I'd suggest that you set fairly high standards for your PQ Settings tab -- otherwise you'll get all kinds of meaningless spot play/subcategories showing up. A good start might be to insist on at least 50 bets and at least a 1.20 LT True Impact. This feature is new to me too, so I can't give you any definitive "best" settings yet. (Note that the spot plays-modified probabilities insists that the spot play/subcategory has at least 100 long-term bets before it will accept it.) The default is for this option to be turned off. If you want to use this new option, go to the General tab of the Setup dialog and check the Use Spot Plays to Estimate Probabilities When Available option. Note that using this option will slow down the computation of betting lines because all the spot plays for that race must be computed before the betting line can be finalized. Also note that you can toggle each spot play's ability to modify the betting line's probabilities on and off. Simply go to the Spot Plays tab of the Setup dialog and click the Modify Prob column for any spot play. A button will toggle the value from Y to N. When you've made the changes you want, click the OK button to save your changes and close the dialog. �1/5/2004 �We know that, in the win pool, the track takes out around 18% of each dollar bet. It varies from track to track, but that's a rough average. Breakage probably adds another penny or so to that total. Your "effective payback," which is the percentage amount you can expect back from each dollar you put through the window on random bests, should be around .81, or a 19 cents loss per dollar bet. However, if you bet even amounts on every horse, your effective payback is lower than the .81 or so you'd expect it to be from the track take because you're betting proportionally more on longshots than the public does. (The public only bets a small fraction of its money on longshots.) Overall we're dealing with an effective payback in the win pool of about .78. Not a very good situation, really, but this is the game we're playing. This .78 is the field we're playing on. We have to do 28% better than average (1.00/.78 = 1.28) before we even get to break-even. �1/5/2004 The assumption that almost all handicappers go on is that the playing field is level. But is it? Wouldn't you like to handicap a situation where you could bet every horse and break even or maybe show a profit, rather than the typical situation where you start out 22 cents in the hole? The Effective Payback Chart is a new feature in this version of The Capper. It's located in the Effective Payback Chart tab of the General Reports dialog. To use it, select "All" or any single track from the first list. Then select "All" or any subcategory from the second list. Click the Create Effective Payback Chart button. A chart like this will be computed:
The horizontal axis of the chart breaks down all bets to their track odds level, from 1/9 all the way up to 99/1. The vertical axis measures the Return On Investment for all the bets at each odds level. The green line shows you the break-even point. The red line graphs out the ROI for the different odds levels. For instance, in the example above, you can see that 10/1 shots have about a .70 ROI. Remember: effective payback is the "playing field" you're dealing with as a bettor. Effective payback gets even more interesting when you break it down by track or race type, etc. It looks like you can bet every horse at certain tracks during certain periods and make a profit. That's because so many longshots are winning that the effective payback at that track is actually positive. Whether it's possible to jump on these situations and make a profit is still an open question. �In the PQ Spot Plays tab, you can now toggle on or off three groups of subcategories: Race-Specific subcategories (such as Dirt, MCL, or statebred), Horse-Specific subcategories (such as Cramer Running Style EP, Track Odds < 2/1, or Top 2 Ranked 1C), and Track-Specific subcategories (such as BEL, MNR, or SA). If, for instance, you only want to use Race-Specific subcategories, you check that option and leave the other two unchecked. �1/5/2004 �Added buttons to Spot Plays tab of Setup dialog so that all of the cells in each of the Yes/No columns can be changed at once:
�Changed the Boldness of Betting Line setting on the General tab of the Setups dialog so that it's much bolder. This feature makes the betting line more opinionated, so that the top horses get more probability assigned to them and therefore have lower fair odds. With this change, I don't recommend a setting above 8 in most circumstances. If you set this option to 10, your betting line will be so opinionated it will usually give the top horse 1/9 fair odds and the rest of the horses will be out of the betting line. �1/5/2004 Added these new spot plays: �CSP: Bad ML Favorite. The rules are: Top ML horse; Not in Capper top 3 picks; 4+ rank 1C OR 6+ rank BC OR went off at 11/1+ last race OR last race blinkers off, this race blinkers on. Crappy Spot Plays intentionally look for bad plays with low ROIs. Avoiding these plays or betting against them can be a good strategy. �Mid Odds Trainer Play. The rules are: Top CT horse; ML Odds from 9/2 to 9/1. This spot play tries to take advantage of the favorable effective payback in the 6/1 to 10/1 track odds area. In a recent study, the CT predictor had the highest overall ROI of any predictor, so that was used as a filter. �Prepping for a Payout. The rules are: Last 3 races within 90 days; Last race out of money; 1st-to-3rd at any point of call in any of last 3 races; 5 or < LB last race 2C; Last race SC Beaten Lengths < 2C BL; Best of last 3 Cramer SR not lower than 5 below CSR par; ML Odds 5/1+. �DSP: 45+ Day Layoff. The rules for this Diagnostic Spot Play are: The horse has been laid off for 45+ days. (The point of a Diagnostic Spot Play is to research a certain factor and look for opportunities.) �DSP: Blinkers On. The rules for this Diagnostic Spot Play are: The horse has added blinkers for today's race. �Introducing: (drum roll please) Spot Play Charts. The Capper is the first handicapping program to incorporate the tools of technical analysis and apply them to handicapping. In the stock and commodity markets, technical analysis is the study of time, price and sentiment of a chosen equity as shown on charts. Technical analysts often look for patterns in the charts to predict future movements of those charts. These patterns and indicators can get very esoteric -- you'll hear about stochastic oscillators, relative strength, etc. But a chart is really just a visual way of analyzing a lot of underlying numbers. And even though the stock market and horse race handicapping are different animals, some of technical analysis' concepts are useful in handicapping. Here's an example of the kind of charts you get with The Capper:
This chart tracks the progress of a certain spot play (the 5YO Gelding/Good Trainer spot play) in a certain subcategory (low claimers) over a period of over three months. The thick red line you see if the Profit/Loss line; the thin green line is the 2 Week Moving Average line, the two blue lines are the Bollinger Bands, and the cyan line is the Takeout line (in other words, the amount you could expect to lose if you just lost the takeout percentage on every bet). Many of the analyses that technical analysts perform on stocks can now be carried out with horse racing spot plays. Stock charts detail the movement of price over time, while the spot play charts detail the movement of profit/loss over time. To me, they are unparalleled tools for understanding a mass of numbers regarding a certain handicapping situation. And while they don't reflect (at least not directly) the oppositional forces of supply and demand the way stock charts do, they do exhibit real trends at the race track over time -- what I call causal phases. For instance, look at the following chart:
This spot play/subcategory -- Blinkers Off in maiden claiming races -- was a steady loser for about six weeks, losing at a much worse rate than the track take. Then it had a big win around mid-August, and since then has been moderately profitable for almost two months. Its performance since mid-August is in stark contrast to its performance earlier in the summer. Now, most of what goes on in these charts is noise. As I've written in the past, we humans have a tendency to see patterns where none exist. But that doesn't mean that there aren't valid patterns out there. (Just because you're paranoid doesn't mean they're not trying to get you.) The pattern in this chart seems to me to indicate a possible causal phase. Why did maiden claimers with blinkers off turn profitable in mid-summer? I don't know, but I don't have to know why. All I have to know is that it's happening. Spot play charts help you see through the noise of numbers and spot trends that are otherwise invisible. �9/23/2003 �Added Import/Recalculate and Import/Recalculate and Print New Races icons to the icon bar for your convenience. These just allow you one-click access to the same functions that were previously only available in The Capper's View menu. �9/23/2003
�Added 145 new subcategories to the Spot Play Breakdown report. Thanks to Mark Dunwell for the idea. These new subcategories are based on each horse's characteristics, not just the race characteristics (for instance, sprint, dirt, etc.) as before. They include things like running style, track odds, fair odds, post position, medication, equipment, and rankings for The Capper's various predictors:
�Added the current PQ Spot Play settings to the report header of the PQ Spot Play reports. That way you can easily see what your settings were when this report was calculated:
�Changed the Top Capper by 5+/ML Fav spot play so that it once again applies to all races, not just stakes. �9/23/2003 �In the Output tab of the Setup dialog, added an option to sort the Applicable Spot Plays report by spot play + track + race number OR by track + race number (as it is now). �9/23/2003 �In the Past Performance dialog, the leftmost field (the Race Date field) is a Cyan color before any layoff of 45+ days. This gives you a quick visual cue for layoffs. When printing the pps, you'll see a line in the date of race field which indicates 45+ day layoffs. �9/23/2003 �Added the Fundamental Contenders Spot Play. This was the group-consensus spot play on Capper Talk for August, authored mainly by Jim Nabrit. It looks for a top Capper horse who is among the best in speed, class, form and pace. �9/23/2003 �Added the Post Bias Spot Play. This looks for a situation where a strong post bias exists and then picks the top Post Bias horse. �9/23/2003 �Added the Cramer Ratings Spot Play. This looks for the best recent horse and the best overall horse using Cramer speed figures. If a horse is both, it qualifies. �9/23/2003 �Added the Early Horse Early Race Spot Play. �9/23/2003 �I've
created a new report: the Performance Qualified Spot Plays report.
This report allows you to set a bunch of different "performance
qualifiers" that dictate whether your spot plays will show up in
this report or not, based on how well they've been performing. These
performance qualifiers are for both Long Term (LT) and Short Term
(ST) performance. So, for instance, you could go to the Qualified
Spot Plays tab of the Setup dialog and set your requirements to
this: 100 Minimum # Number LT Bets, 90 Minimum LT Confidence, and
1.01 Minimum ST Flat ROI. (These are actually the default values for
this tab.) Set like that, only the spot play subcategories that
include 100 LT bets, a 90% LT confidence level, and at least a 1.01
Return On Investment over the short term will show up.
�8/5/2003 In the example below, the first spot play to qualify is at Delaware park on 8/4/03, in race 1. The horse is #8, Coyote Message. This horse is showing up because the Last Chance Bomb Getter has been doing well enough at DEL (the subcategory that qualified here was the individual track) to qualify. You can see that over the Long Term, which is set to 10 Years Ago (even though I've only got a couple of months of data so far), the stats for Last Chance Bomb Getters at DEL are 5 wins out of 50 bets, for a 10% bet win% and an 11% race win%. The average odds of these longshots were 23/1. Out of $100 bet (50 * $2 bets), a profit of 82.80 was made, for an ROI of 1.83. The True Impact for Last Chance Bomb Getters at DEL was 2.23, and the suggested Full Kelly bet is 5% of bankroll. Nothing shows up for the Confidence Level or the RollX because they require 100 bets before being displayed. The Short Term stats for each play are displayed directly beneath the Long Term stats. If you look at the header, you can see that in this example, the Short Term is set to 1 Month Ago:
�In the Spot Plays tab of the Setup dialog, added these two new prompts: Spot Plays Short Term Starting Cutoff Date and Spot Plays Long Term Starting Cutoff Date. These date ranges are used in both the Spot Play Breakdowns and the PQ Spot Plays Report. There's also a new QSP Print/Display column, which will allow you to turn off any particular spot plays in the PQ Spot Plays report if you want to. �8/5/2003 �The Spot Play Breakdown reports were modified to include both Long Term and Short Term statistics. �8/5/2003 �Added three new subcategories to the Spot Play Breakdowns: A Tracks, B Tracks, C Tracks. The A Tracks are the major tracks: the B Tracks are the second-tier tracks, and the C Tracks are all the rest. This is often a significant breakdown. If you go to the Help menu and choose the List of ABC Tracks option, you can see a listing of each track's classification. �8/5/2003 �Added three new checkboxes to the Predictors tab of the Setup dialog: Equal Weights for All Predictors, Only Weight Predictors with Positive ROIs, and Use New Method of Calculating True Impact. The default is for the Use New Method of Calculating True Impact to be checked and the other two unchecked. This new method seems to work well and is recommended. �8/5/2003 �In the Etc. output, added these fields: the paceline number (for instance, 2 means the second-to-last past performance), the paceline track, the paceline surface, and the paceline distance. �8/5/2003 �The Average Times are now in the printed Pace Summary output. �8/5/2003 �Added a Past Performance Graph, accessible from the Past Performances dialog. If you click the PP Graph button, the HDW Pace and Speed figures for the current horse's past performances will be displayed graphically. (These same pace and speed figures are in the horse's pps and can be viewed by moving the bar and looking at the data on the right-hand side of the right pane of the pp grid.) In the Past Performance Graph, note that the closest band labeled "1" represents the horse's last race; the second-closest band labeled "2" represents the horse's second-to-last race, etc. This graph should be helpful to fitness handicappers trying to understand each horse's form -- a picture can be worth a thousand stats. �5/16/2003
�Added a Print/Display column to the table in the Spot Plays tab of the Setup dialog. Each spot play can be toggled on (Y) or off (N) by clicking on this column and pressing OK when you're done. If you set a spot play to N for Print/Display and Y for Active, that means it will not be printed out or displayed, but the stats will still be computed and can be viewed in the Spot Plays Breakdown report. �5/16/2003
�Added
these new public spot plays. If you go to the Spot Plays tab of the
Setup dialog and rest your mouse pointer over the Rules column for a
second, you can see the rules for each of these spot plays
(5/16/2003): �Added a new report called the Spot Play Breakdown to the General Reports dialog. The list on the left contains all the active spot plays in your database. If you click on one of the spot plays, the program will compute and then display the breakdown report for that spot play on the right. All the bets that qualified are listed, broken down by various subcategories such as dirt, turf, sprint, route, etc. Each subcategory's statistics are displayed: number of wins, number of bets, bet win%, race win%, average odds, total bet, profit/loss and flat ROI. If applicable (these stats generally require at least 30 bets and a profit), you'll see stats for Full Kelly, Geometric Mean, Confidence and RollX. The subcategory with the highest RollX (if any qualify) will be highlighted in red as a suggestion of a good betting category. �4/29/2003
�A new feature allows you to turn particular predictors on or off. If you turn one or more of The Capper's 18 predictors off, that means that it will have no influence on the Betting Line. It will still be computed and displayed in the Predictors output for your reference, though. �4/29/2003
�You
can now export the Fair Odds for the handicapped races on a
particular today to a third-party tote program called At the Races.
At the Races is an advanced gambling tool. With At the Races, horse
players can complete analyses that are virtually impossible to
perform manually. They can, for instance: Go to http://www.homebased2.com/atr/at_the_races.htm for more information about At the Races. �4/2/2003
�I've added projected Turn Time and projected Final Fraction to the Pace Summary, both in the Race Reports dialog and the printed Pace Summary output. �4/2/2003
�I've always thought comprehensive Favorite Stats would be very useful when approaching a race. They let you know what caliber of favorite you're generally facing in this situation. Now The Capper has them. As usual, the True Impact figure is most important. For instance, in the type of race shown below, favorites have been winning 16% more than they should given their odds. You'll soon find situations where favorites dominate and others where they are extremely weak. These stats appear in the Betting Line tab of the Race Reports dialog and in the printed Betting Line output. �4/2/2003
�Added a new Horse Notes feature. Click on the Notes field of the Etc. grid and enter your notes about this horse. The notes will be saved and will be displayed and editable the next time the horse appears in another race. These Horse Notes won't be deleted with the race data. They'll be retained so you can view your notes each time a horse returns to the track (unless you have to replace your entire database for some reason). �4/2/2003
�Added pedigree numbers to the pps. These are numbers from 0 to 1500, broken down by these categories: All Dirt, Dirt Sprints, Dirt Routes, All Turf, Turf Sprints, Turf Routes, All Off Tracks, Dirt Off-Tracks and Turf Off-Tracks. These can give you an idea of each horse's capabilities for different situations based on its sire's and broodmare sire's records. �2/21/03
�In the printed Predictors output, added a small 1, 2 or 3 next to the top three scores in each column. That way, your eye can easily go to the top three for each predictor, as you do using colors in the Race Reports dialog. �2/21/03
�Added NTL (Need To Lead). It's displayed in the Pace Summary and in each horse's pps. Need To Lead is the same as Quirin's speed points, except that it's a 0-to-10 number rather than a 0-to-8 number. In my opinion, NTL measures a horse's desire to get out front early. Since most any horse that wants to get out front will get out front, it's a very good predictor of who will be near the front of the pace at the first call. By popular request, I've also added DSLR (Days Since Last Race). It's displayed in the Etc output and in each horse's pps. �2/21/03 �Removed the ET (Early Time), PT (Presser Time) and ST (Sustained Time) predictors and replaced them with three new predictors: TT (Turn Time), FF (Final Fraction) and PC (Projected Cramer, which is Jim Cramer's projected rating for each horse in the race). I did this because I wanted more diversity than ET, PT and ST gave me. They all correlated too closely with FC and with each other because they all contained the FC projected time in their makeup. What has surprised me so far is that TT and FF have been very good at certain tracks. I expect PC to be one of the best predictors overall with one of the highest win percentages. �2/21/03 �Added a new spot play called "Top Early Sprinter." Here are the rules:
Once we've tried it for
awhile, I'm open to suggestions for further tweaking.
�2/21/03 �Added a new Spot Plays feature to The Capper:
The Spot Plays feature
searches through each race being handicapped for horses that qualify
for certain spot plays. When a
qualifying horse is found, it is displayed in the Spot Plays tab. If
no qualifying horses are found for a particular race, the Spot Plays
tab will remain blank. The Spot Plays output is also printed out as
another output, like the Predictors output or the Pace Summary
output. I don't claim that the Spot
Plays I've programmed so far are great money-makers that will
require a wheelbarrow to remove the cash from the
mutuel windows. I
do claim that, unlike most spot plays out there, you will know just
how well they're doing. The Capper keeps track of the number of
wins, starts, bet win%, race win% and ROI for each spot play and
reports that to you when it shows you the qualifying spot plays.
�After
you've selected some races for printing in the Select Races dialog,
or you've Imported, Recalculated and Printed New Races, a new report
called Applicable Spot Plays is generated. This report lists (by
track/date/race/program number) all the spot plays that apply for
the races you printed. If you're sending your reports to the
printer, this report will print out after all your race reports have
printed. If you're generating PDF files, you can find this report
under the User-Generated Files dialog. It'll look something like
this: SpotPlays_2003_01_21_1448.PDF. (This example is the Applicable
Spot Plays report that was generated on January 21, 2003 at 2:48
PM.) The Applicable Spot Play report is handy because it displays
all the current spot plays in one place. �1/21/03 �Added an Exacta Grid and Quinella Grid to the output, both printed and in the Race Reports dialog. The grids tell you the "Bet Pays" for each combination, based on the betting line's probabilities. A Bet Pay is the fair amount for each combination plus whatever edge you have configured.
There is also a new tab for configuring the Exacta and Quinella Grids in the Setup dialog. You can leave the program set to its defaults, but here's an explanation of the various options:
�Added a prompt in the
General tab of the Setup dialog: Minimum True Impact that Gets
Weight (1.00 to 1.50). The default for this new prompt is 1.10. Any
True Impact, as shown in the Predictors output, is ignored if it's
equal or less than 1.10, and only the portion above 1.10 is used to
calculate the weights of the predictors. Previously, any True Impact
equal to or below 1.00 was ignored. The effect of this should be to
cut out a little bit of the "noise" of the predictors. Many
predictors will get True Impacts slightly above 1.00 purely by
chance, so this will make The Capper focus in even more on the
predictors that are really out-performing their odds at the current
time. �12/19/02 �Added Win% and ROI figures for each predictor in the Predictors output. These are displayed just above the True Impact and Weights rows. These tell you what percentage of the time the top-ranked horse for each predictor won and what the flat ROI (1.00 is break-even) would be if you bet the top horse. �12/19/02
�Added a list in the Entries tab of the Race Reports dialog which allows you to account for off-tracks. If the track condition of a race has changed from its default of fast or firm, you can change today's track condition here.
The effect is to, if
necessary, change the category of the predictor model that is
used to weight the predictors. For instance, the program may
have been using CRC/Dirt/fst as the category of model races it
was using. If you say today's track condition is muddy, the
program will revert to a different category: for instance, CRC/Dirt/my
if there are enough muddy races, or more likely, CRC/Dirt, so it
looks at all dirt races, not just the fast track ones.
�12/19/02
�Added an option in the Output tab of the Setup Dialog to print to
both your Printer and PDF files at the same time. If you choose this
option, your output will be printed out, plus a PDF file will be
created at the same time. �11/20/02 �Added a Display Top Five Stats button to the Betting Line tab of the Race Reports dialog:
If you click it, it will display the Top Five Win% and ROI for the current track. Also added the same Top Five Stats to the printed Betting Line output. Note that this is based on the date of the race being handicapped, not today's date, so it can sometimes be different than the Top Five Win% and ROI report on the General Reports dialog.
Also
added a feature to the Top Five report that displays with
the Betting Line (not the one in the General Reports dialog).
When displaying it, you will often see one of the cell's
backgrounds in the overlay or tote-action column displayed in
red. This tells you which level generated the most flat profit
for that column. For instance, if the cell for the Top 2 Horses
in the Overlay column is red, that means you would have made the
most profit betting overlays from the top 2 positions in the
betting line -- more than if you'd bet just the top 1, or the
top 3, top 4, or top 5. In the printed output, you'll see
a star rather than a red background. �11/20/02 �I changed the paceline picker so that it will try to avoid picking a turf paceline for a dirt race. This can sometimes still happen if there is no other valid paceline which meets the method's parameters. For instance, the Best Recent method looks for the best paceline within 90 days of the race. If you've got a dirt race today, and a horse has only one paceline within 90 days, and that's a turf race, then the program will pick that paceline. But except for the occasional exception, The Capper will avoid turf pacelines in dirt races. �11/20/02 Copyright �2003 NetCapper Inc. All rights reserved. |